Simplify Complex Information with Visual Journalism
Visual Journalism, aka infographics, tells a complex story or illustrates a detailed process in a colorful, impactful single page. The information is distilled down to its most basic core and illustrated with images, icons, graphic layout, and color.
Because a picture is truly worth a thousand words.
Start Creating Impactful Infographics Today!
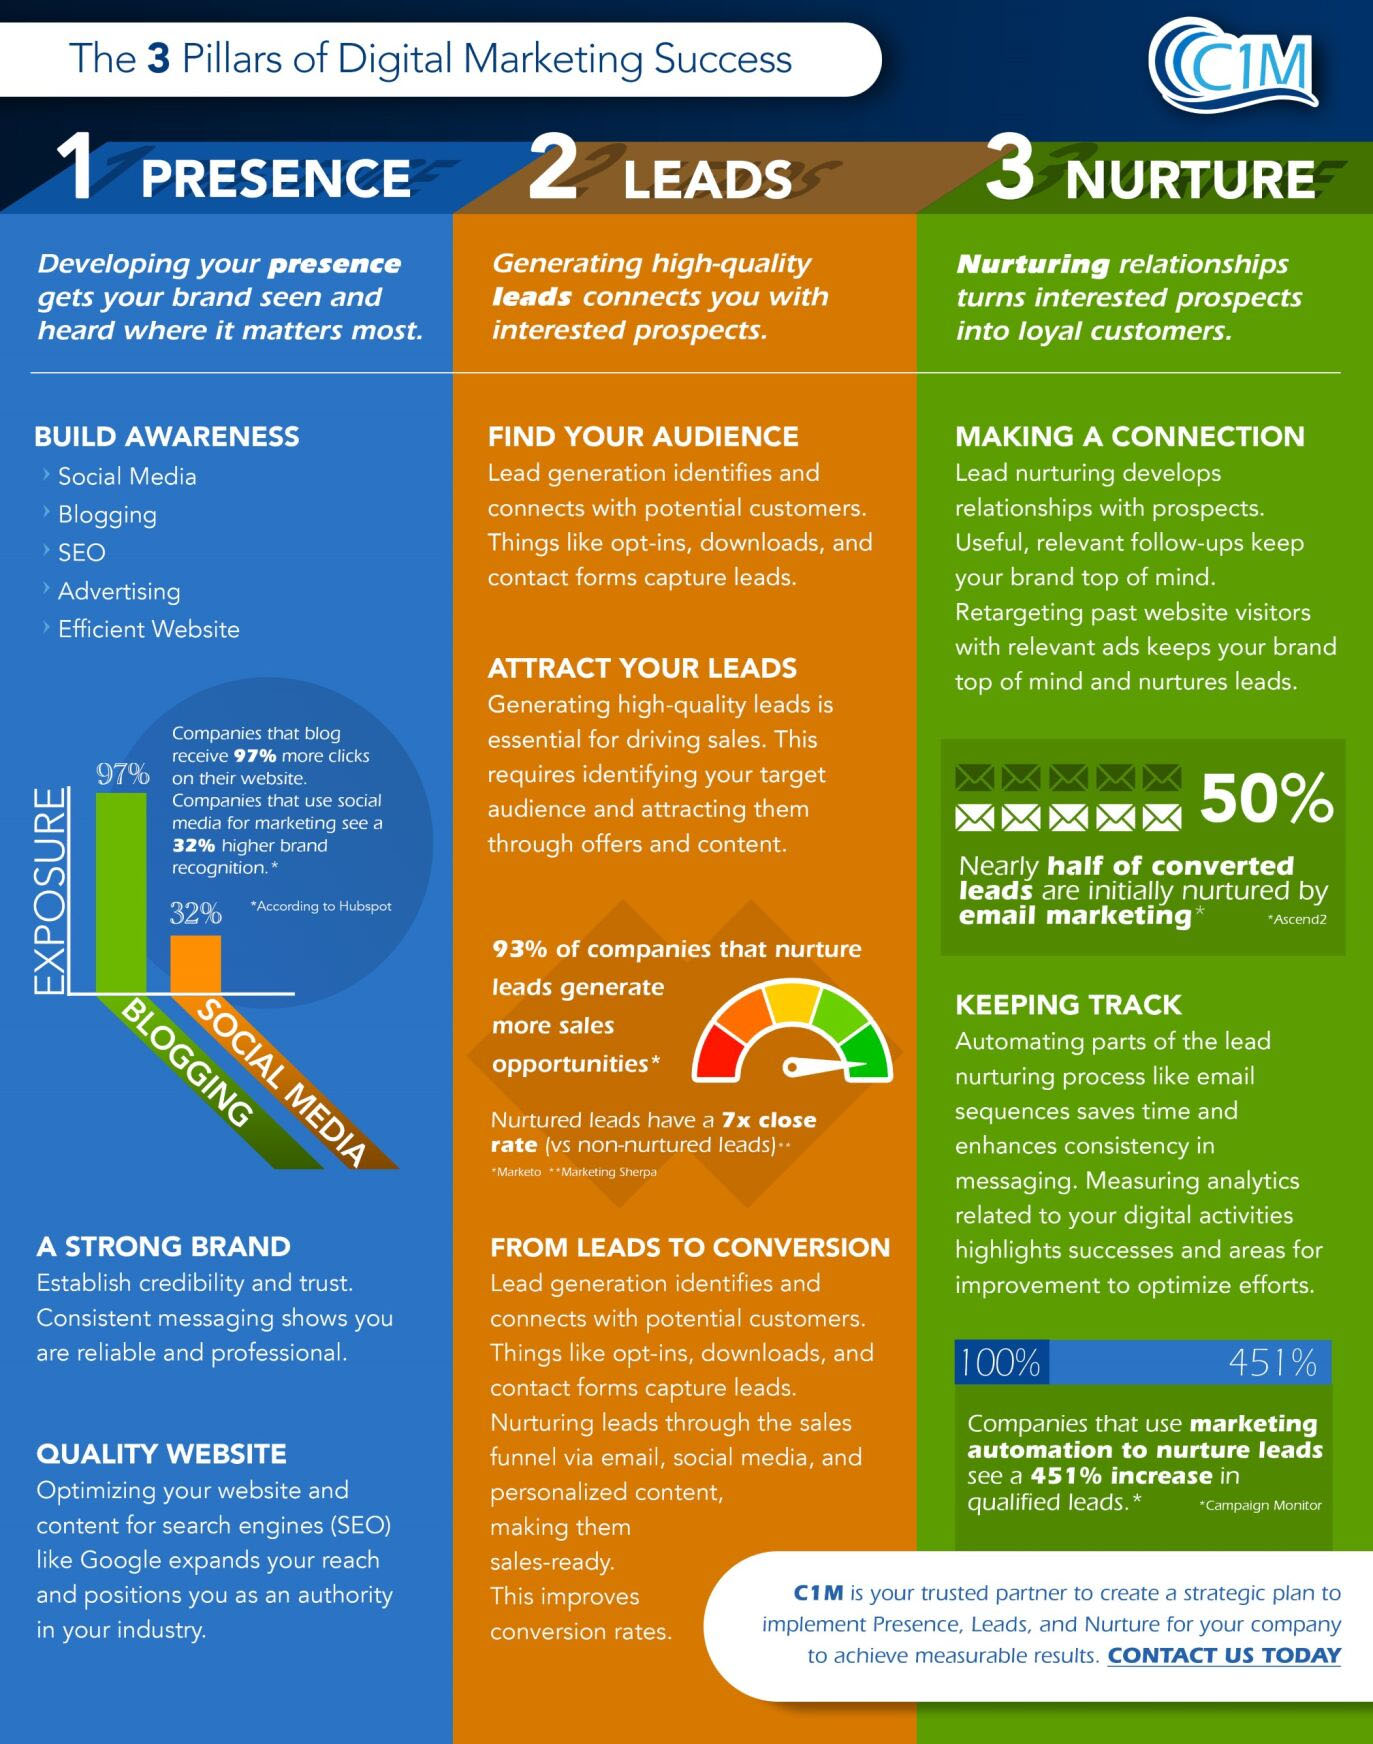
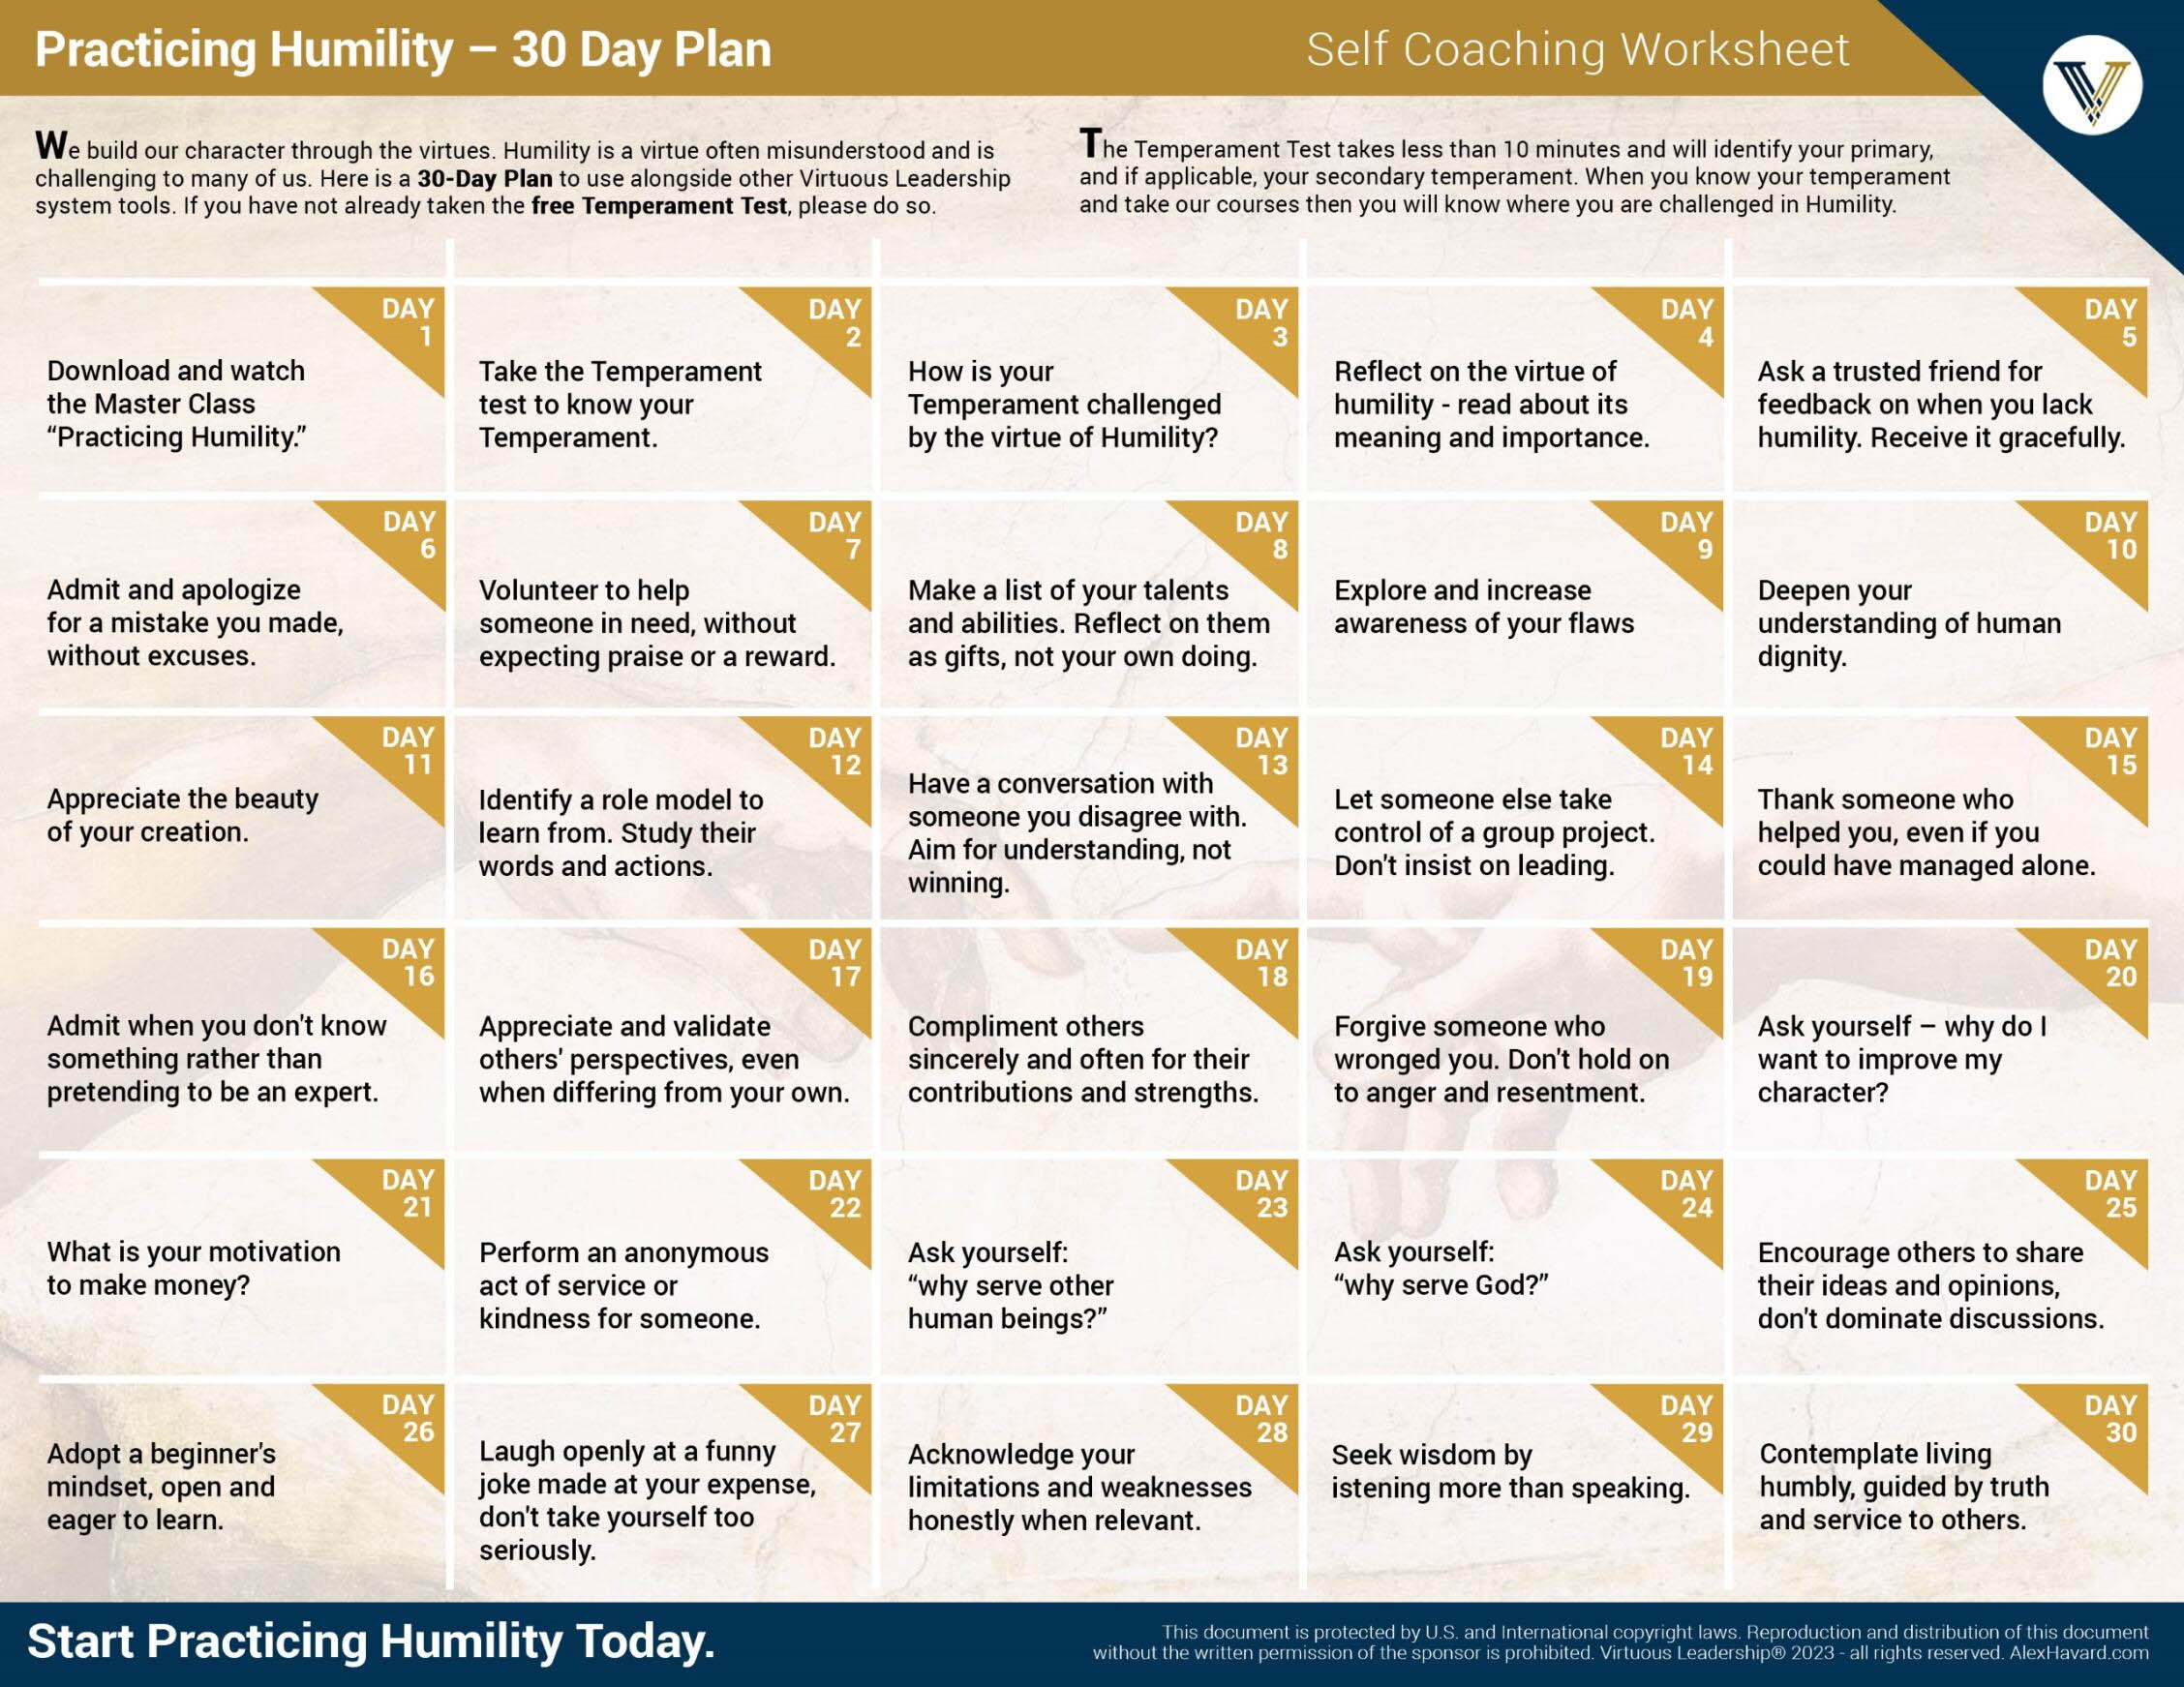
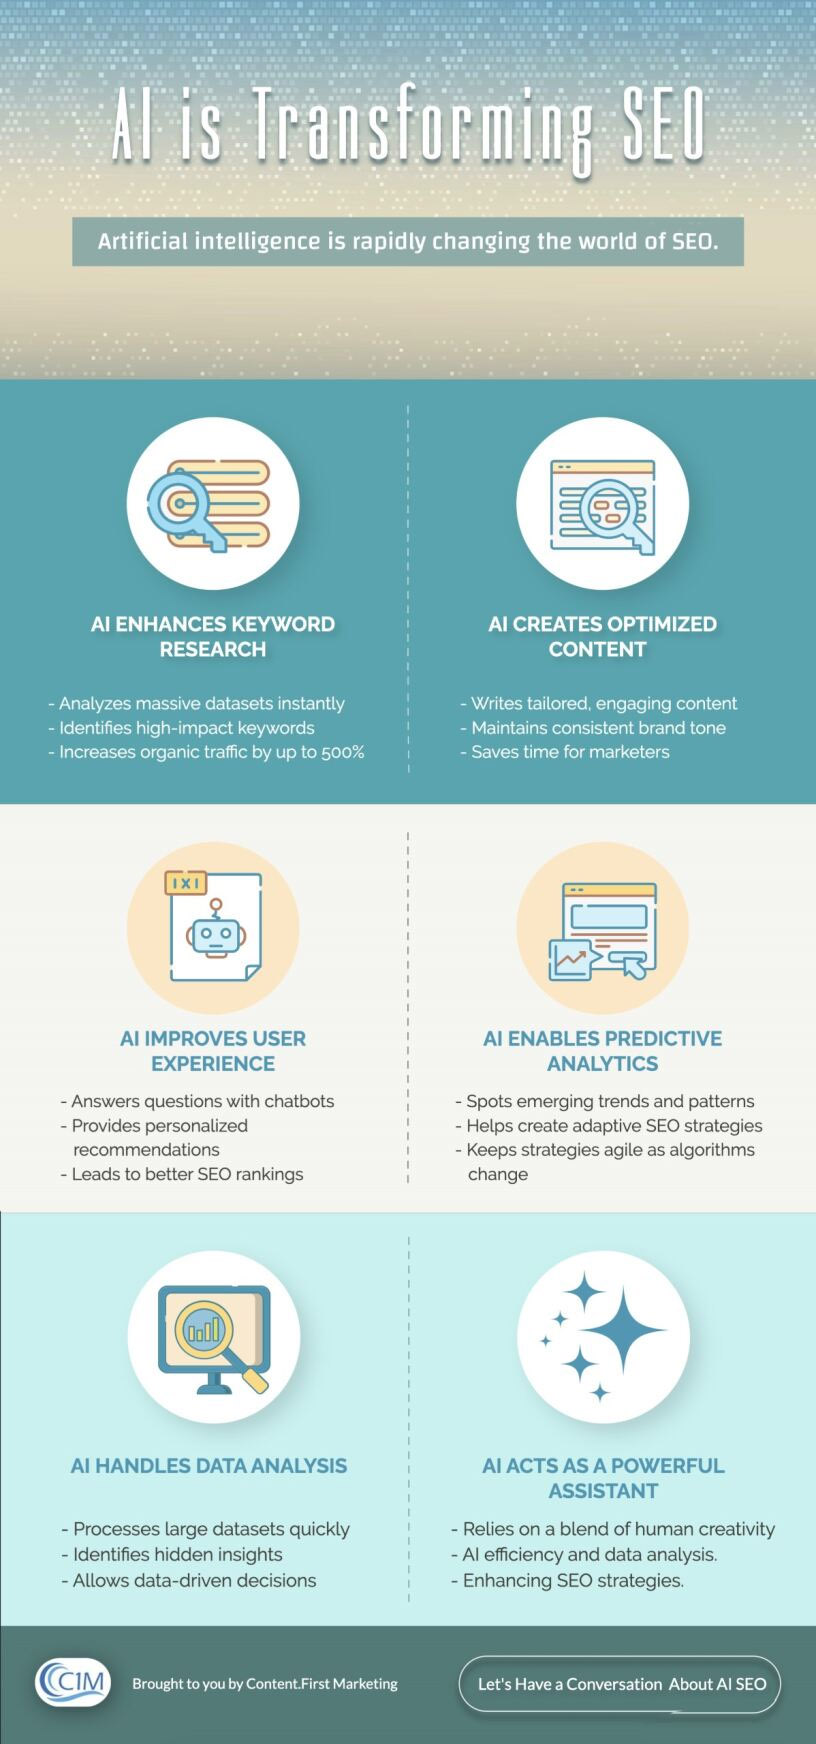
examples of our work
Why Use Visual Journalism?
We live in a fast-paced world where attention spans are shorter than a ride on a six-foot wave. In fact, recent studies reveal that attention spans have decreased to only 8.25 seconds. You don’t want all of the research and information you have to go unnoticed. An infographic can help.

Types of Visual Journalism
Listicle
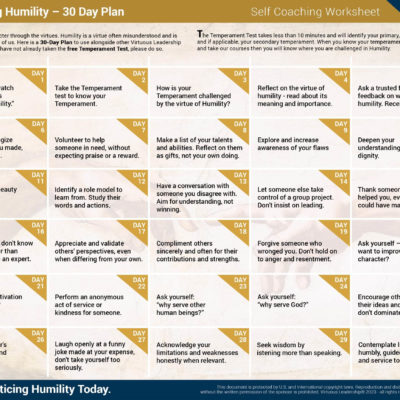
A visual interpretation of a list of any kind, such as a calendar, checklist of steps or items, etc.
Comparison
A side-by-side comparison of services or products.
Informational
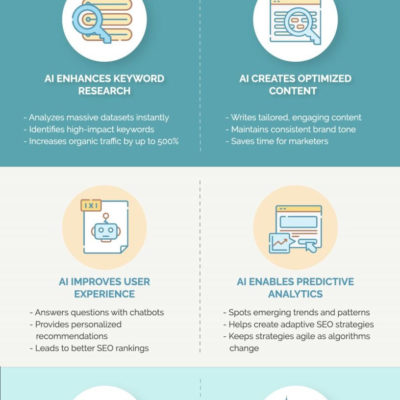
An illustration of words in a visual manner that is easy to consume and understand.
Process
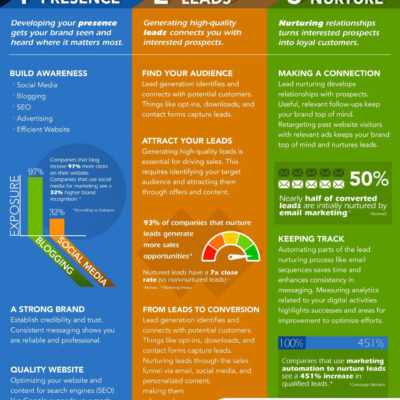
A visual representation of a step-by-step process, procedure, or a plan of action.
Statistical
Large data sets visually illustrated for maximum impact and understanding.
Geographic
A large amount of data that’s separated into geographic regions, then displayed visually.
